Summary
- The problem
- A contamination control strategy is often written after validation and then drifts from the controls on the floor. When a signal appears, it is hard to show which control it tests, how current the evidence behind that control is, and which product was exposed.
- Seal’s approach
- Seal links contamination risks, their routes and barriers, the controls that address them and the monitoring, qualification and investigation evidence behind each control. Signals, changes and periodic review act on the same graph, and the approved narrative is assembled from it.
- What changes
- Every control claim shows its current evidence and owner, and overreliance on one weak control becomes visible. A change cannot close until the affected CCS links and narrative are reviewed.
- Where to start
- One contamination pathway through one aseptic filling process, from facility and people flows to signals, investigation, change and periodic review. Book a demo.
A contamination control strategy is the working logic that explains how microbial, particulate, endotoxin and cross-contamination risks are prevented, detected, investigated and kept under control across the facility and product lifecycle. It is more than a summary document written after validation.
Seal connects contamination pathways to the controls that address them and to the monitoring, deviations and changes that test those controls. Each claim in the narrative can be traced to current operating evidence.
1Start from the product, the process and the pathways.
The strategy begins with the product, its sterilisation or aseptic path, its process flow and the facility it runs in. Sterile filtration, terminal sterilisation, aseptic filling, biologics, cell therapy and non-sterile controlled products need different control claims, so the CCS records where each claim applies instead of copying one site-wide statement to every process.
A contamination scenario then identifies the source, the route into the product, the barriers in place and the residual risk.¹ People, utilities, materials and interventions can all contribute. Related scenarios share controls without collapsing into one vague risk.
2Controls are explicit claims with owners.
Each control states what it prevents or detects, its acceptance criteria, the evidence that shows it is working and who responds when it fails. Design controls, procedures, automation, monitoring, testing and release decisions remain distinguishable.
One control can mitigate several risks, and one risk can need several independent barriers. Because the relationships are explicit, the graph shows where the strategy relies on a single weak or unverified control.
Annex 1 places the CCS at the centre of sterile manufacture, as the means of defining critical control points and assessing whether controls and monitoring are effective.² The manufacturer defines the scientific strategy; Seal maintains the evidence network behind it.
2.1Why teams choose Seal for a contamination control strategy
A CCS is usually a document written after validation and revised at periodic review; it describes controls but cannot show whether they are working today. Seal keeps each claim connected to the monitoring, qualification and investigation records that test it, so a signal, change or review starts from the control it concerns. A change cannot close until the affected claims are reviewed, and the strategy stays in step with the floor instead of drifting from it.
| CCS as a document | CCS in Seal | |
|---|---|---|
| Control claim | A paragraph and a table of procedures | A linked control with owner, acceptance, evidence source and failure response |
| Evidence | Summarised at the last review | Current qualification, monitoring and investigation records attached to the claim |
| Signals | Separate EM, utility and deviation reports | Combined indicators assessed against the controls they test |
| Change | The document is updated if someone remembers | The change identifies affected risks and controls and cannot close until they are reviewed |
3Facility, utility and people controls carry their own evidence.
Rooms, grades, pressure cascades and personnel and material flows connect to approved layouts, qualification and routine monitoring. Maintenance, door alarms or a pressure failure identify which risks and product-exposure windows need assessment.
Water, clean steam and gases keep their system boundary, sampling points and limits, and point-of-use results connect to the batches that consumed the utility during the relevant interval.
Gowning, aseptic technique and interventions form the personnel-control system, with qualification that has scope, expiry and remediation. The batch record captures who entered, which intervention occurred, for how long and with what monitoring. Training completion alone does not prove a critical intervention was performed acceptably.
4Cleaning, sterilisation and aseptic operations keep their genealogy.
Disinfectant, contact time, coverage and sporicidal rotation are configured by room and surface, and efficacy studies and environmental isolates connect to the control claim. A completed checklist does not imply effective wet contact time.
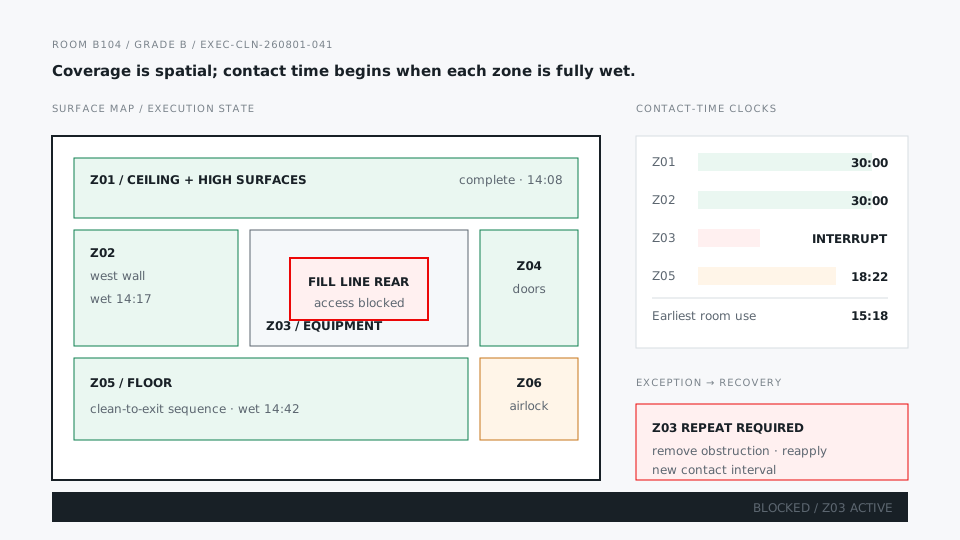
How to read this diagram
A room is released from bounded surface coverage and completed contact-time intervals—not a task-level signature.
- Surface map
- The regime resolves to physical zones and difficult-access equipment.
- Blocked access
- The rear line panel remains an explicit spatial exception.
- Contact time
- Clocks begin as each bounded zone reaches complete wetting.
- Room state
- Return to use remains locked until the repeated zone completes.
Sterilisation and depyrogenation cycles connect the load, parameters and indicators to release. A wet pack, failed indicator or interrupted cycle identifies every item and downstream use affected.
Line setup, filter integrity testing, interventions and fill duration form the executed sterile state. The aseptic process simulation plan defines the interventions, operators and worst cases it challenges, and successful APS evidence supports those defined configurations, not every imaginable operation.
5Monitoring and organisms test the control system.
Viable, non-viable and personnel monitoring results attach to their location, activity and batch, and to the control claim they test.³ Expected, collected, missed, invalid and adverse samples define completeness, so no growth is never confused with no sample.
media lot TSA-772 · custodian RM
72h→30–35°C
48h→3 CFU
Isolates keep their source, identification and related occurrences, and trending considers species, location, activity and route plausibility. An organism match can support a pathway hypothesis without proving transmission; the investigation keeps its limitations and alternative explanations.
6Signals combine weak indicators, and investigations start from exposure.
An action-level result is not the only meaningful warning. Repeated low recoveries, a flora shift, pressure instability or cleaning misses can combine into a CCS signal. The signal record freezes its source population, rules, time window and response, so statistical alerts and expert observation can coexist.
The investigation identifies failed or uncertain controls and the batches and time windows potentially affected, with the relevant evidence already linked. Containment can happen before root cause is known, and later scope reduction keeps its rationale, residual uncertainty and approval.
7Change and periodic review update the graph, not only the document.
A new product, HVAC modification, disinfectant or sampling plan identifies the risks, controls and monitoring it affects.⁴ The change cannot close until the CCS links and narrative are reviewed, and the effective strategy keeps its prior versions.
Periodic review evaluates control status, monitoring completeness, trends and CAPA effectiveness. It distinguishes an evidence gap from a control failure, and a control failure from product impact. Controlled narrative sections draw on approved risks, controls and evidence; authors add the scientific synthesis, and an approved report keeps the versions reviewed while control health continues to update.
8Prove one contamination pathway end to end.
Model one aseptic filling process from facility and people flows through cleaning, interventions and monitoring to batch exposure, investigation and periodic review.
Include a missed sample, a sporicidal contact-time failure, repeated low-level flora and a layout change. The strategy is credible when every control claim shows current evidence and every signal finds the product population exposed.
References
- 1ICH Q9(R1), Quality Risk Management (2023), sections 4 (general quality risk management process) and 5 (risk management methodology). European Medicines Agency
- 2EudraLex Volume 4, Annex 1, Manufacture of Sterile Medicinal Products (2022), section 2.3: a contamination control strategy should be implemented across the facility to define all critical control points and assess the effectiveness of all controls and monitoring measures. European Commission
- 3EudraLex Volume 4, Annex 1, Manufacture of Sterile Medicinal Products (2022), section 9 (environmental and process monitoring). European Commission
- 4ICH Q10, Pharmaceutical Quality System (2008), sections 3.2.2 (corrective and preventive action) and 3.2.3 (change management). ICH
ACapabilities
| Capability | What it covers |
|---|---|
| Living CCS model | Each contamination source links to its routes, risks and controls, and to the evidence, signals, changes and reviews that test them. The approved narrative draws on that structure. |
| Facility and utility controls | Rooms, grades, pressure cascades and flows connect to qualification and routine monitoring. Water, clean steam and gas results connect to the batches that used the utility during the relevant interval. |
| Cleaning and sterilisation | Disinfectant, contact time and sporicidal rotation are configured by room and surface. Sterilisation and depyrogenation cycles connect load, parameters and indicators to release, so a failed cycle identifies the items affected. |
| Aseptic process control | Line setup, filter integrity testing, interventions and fill duration are recorded as the executed sterile state, including who intervened, what was done and for how long. |
| Environmental and process monitoring | Viable, non-viable and personnel results attach to their location, activity, batch and the control claim they test. Missed and invalid samples are recorded, so no growth is never confused with no sample. |
| APS / media fill evidence | The simulation plan defines the interventions, operators and worst cases it challenges. Results, contaminated units, investigations and requalification stay tied to the configurations they support. |
| Contamination signals | Repeated low recoveries, a flora shift, pressure instability or cleaning misses can combine into a CCS signal. Each signal keeps its source population, rules, time window and response. |
| Change and periodic review | A change identifies the risks, controls and monitoring it affects and cannot close until the CCS links and narrative are reviewed. Periodic review separates an evidence gap from a control failure, and a control failure from product impact. |
BConnected records
CQuestions and answers
What is contamination control strategy software?
It keeps the connection between contamination risks, the controls that address them and the evidence that shows whether those controls work. Monitoring, signals, investigations, changes and periodic review act on those same risks and controls, so the strategy is maintained rather than rewritten at each review.
Is a CCS just an Annex 1 document?
No. The CCS connects critical control points with the evidence used to assess control and monitoring effectiveness under Annex 1. Seal treats the approved narrative as an output of that control system, and each claim stays linked to its current risks, controls, evidence and owner.
How is this different from environmental monitoring software?
Environmental monitoring supplies important evidence for the strategy. A CCS also connects facility design, utilities, people, cleaning, sterilisation, aseptic operations and change to the risks that monitoring tests.
Can Seal model one control against several risks?
Yes. Risks and controls are many-to-many. The graph shows which barriers address each pathway, which evidence supports each control and where the strategy relies on a single weak or unverified control.
How are facility changes assessed?
A room, HVAC, flow, utility or monitoring change identifies the contamination scenarios, controls and monitoring it affects. The change cannot close until the affected CCS links and narrative are reviewed, and the effective strategy keeps its prior versions.
Does Seal manage aseptic process simulations?
Yes. The simulation plan defines the interventions, operators and worst cases it challenges, and results, investigations and requalification remain tied to those configurations. Successful APS evidence supports the defined configurations, not every possible operation.
How are microorganisms used in investigation and trending?
Review each isolate alongside its source and identification, then compare related findings by species, location, activity and plausible route. An organism match can support a pathway hypothesis without proving transmission, and the investigation records its limitations and alternative explanations.
Can several small signals be combined?
Yes. A signal definition can combine repeated low recoveries, a flora shift, pressure instability or cleaning misses across a defined population and time window. The signal record keeps its source population, rules and response, so statistical alerts and expert observation can coexist.
How does CCS connect to batch release?
Monitoring, utility, intervention and sterilisation records connect to the batches made during the relevant interval. When an investigation identifies a failed or uncertain control, the potentially affected batches and time windows are linked to it, and open impacts remain visible during disposition.
How often should a CCS be reviewed?
The manufacturer sets a risk-based review cadence and the events that trigger an earlier review. Seal assembles control status, monitoring completeness, trends and CAPA effectiveness for that review, and a change cannot close until the affected CCS links are reviewed.
Can Seal draft the CCS narrative?
Controlled narrative sections and evidence tables can draw on approved risks, controls and evidence. Authors add the scientific synthesis, and an approved report keeps the versions it reviewed while control status continues to update.
What should the first implementation prove?
Start with an aseptic filling process and demonstrate how its controls and monitoring evidence support batch review. Test missing samples, failed cleaning contact time, recurring flora and changes to the layout.