
Summary
- What it covers
- Continued process verification, deviations, stability, complaints, change control, supplier quality and batch release. All capabilities.
- Neil
- Neil drafts the review from the record, each figure linked to the rows it counts, and raises a shift it finds between reviews. Section owners review the draft and QA signs it. About Neil.
- Where to start
- One product review and the source populations your team currently has to reconcile. Book a demo.
1Coordinate the review across every evidence domain.
Coordinate the annual product quality review (APQR) across manufacturing, laboratory, stability, suppliers and field experience. Carry the scientific conclusions into work with owners and follow-up.
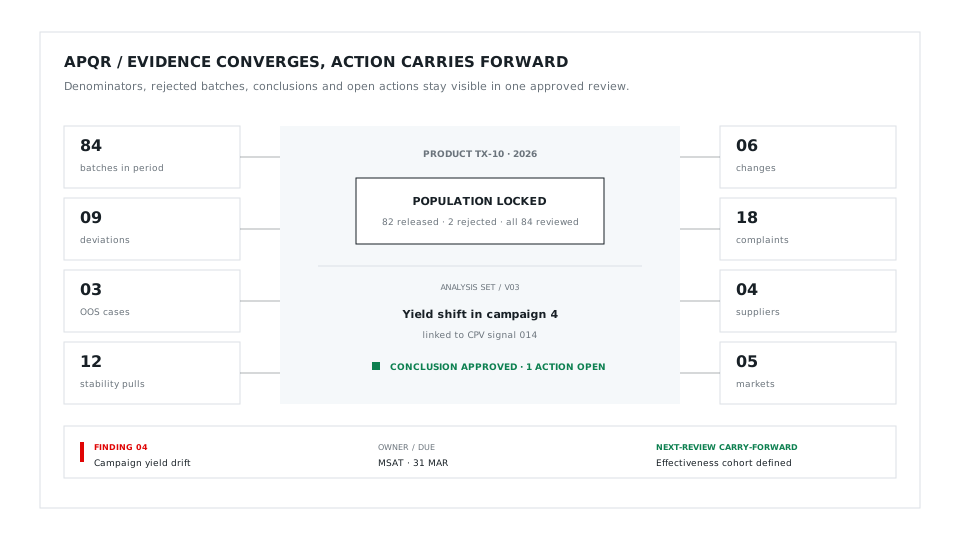
Annual product reviews are traditionally compiled once a year from exports of batch, laboratory, complaint and change records, and a large part of the effort goes into reconciling the population. Seal starts the review from an agreed population drawn from records that already share one platform, reconciled before anything is analysed.
Conclusions become owned actions on the same records, so a trend in next year’s review can be traced to the decision that preceded it.
2Set the scope: agree what the review includes before counting it.
Define products, presentations, sites, review period and any grouping rationale. Assign a source owner and completeness check to each evidence domain. Keep rejected, pending, excluded and late-arriving records distinguishable from missing data.
Reconcile expected records with the selected population before interpreting rates, trends or apparent absence of events.
3Connect evidence: bring the whole product history into view.
Connect yields, batch outcomes, laboratory and stability results with methods and specifications. Include supplier changes, incoming quality, deviations, OOS/OOT, CAPA, complaints, returns and recalls within the agreed scope. Retain differences between sites and presentations.
Check completeness across domains, including external partners. An empty export is not proof that no relevant event occurred.
4Evaluate: keep the basis behind each chart and conclusion.
Review trends, recurrence, stability and the observed effect of changes. Retain cohorts, denominators, exclusions and analysis versions so charts remain reproducible. Ask Neil to prepare a referenced narrative; reviewers determine what the evidence supports.
Freeze the reviewed evidence cut with the issued report. Later corrections or information need a traceable update.
5Follow through: turn each finding into assigned work.
Connect conclusions to CAPA, process or method change, supplier follow-up, validation work and other agreed actions. Assign an owner, due date and evidence requirement. Keep prior commitments visible in the next review.
Distinguish administrative closure from an effective response. Recurrence remains connected to the earlier finding and decision. The next review evaluates the effect of earlier actions.
6A complete review connects different kinds of evidence.
Bring batch performance, methods, materials, stability, deviations, complaints and changes into the same product context.
Give each source domain an owner, period and completeness check. Separate missing data from a true absence of events. Keep product grouping and exclusions explicit rather than flattening different presentations or sites into one average.
7The action survives the report.
Link each follow-up to the finding, owner, due date and evidence needed to resolve it.
Review whether prior actions were effective, not only administratively closed. A later trend or recurrence should be traceable to the earlier product review and the decision made then.
ACapabilities
| Capability | What it covers |
|---|---|
| Controlled review scope | Define the products, presentations, sites, period, population rules, sections, owners and approval before analysis begins. |
| Batch population reconciliation | Reconcile manufactured, released, rejected, reworked, returned and pending batches across source systems, so each batch in scope appears with its state at the data cut. |
| Laboratory and stability evidence | Results keep their sample, method, specification, OOS or OOT history, stability condition and timepoint. |
| Deviation and CAPA patterns | Group quality events by process, cause, material or equipment, and review recurrence and CAPA effectiveness in the same product context. |
| Supplier and material quality | Link the materials and sources actually used to incoming failures, supplier changes and complaints. |
| Complaints and field evidence | Connect complaints, returns, adverse events and recalls to the manufactured populations they concern. |
| Governed statistics | Each analysis keeps its dataset, cohort, denominator, exclusions and method version, so a chart or capability figure can be reproduced. |
| Change effectiveness | Compare an implemented change’s expected outcome with the batches and evidence produced after it took effect. |
| Evidence-backed conclusions | Each review conclusion links to the datasets and source records behind it, with its limitations and approval. |
| Persistent follow-up | Conclusions become CAPA, change, validation or supplier actions with owners, and their completion evidence is available to the next review. |