The APR that took three people four weeks.
January. Time for the Annual Product Review. Three people clear their calendars. One exports batch data from the MES into Excel. Another pulls deviation and CAPA metrics from the QMS. A third copies stability data from the LIMS. They spend a week reconciling numbers that don't match because each system counts differently. Another week formatting tables. Another writing the narrative summary. A fourth week routing for review, catching errors reviewers found, re-exporting data that changed during the review cycle.
The APR is a defined format with defined data. Every number in it already existed in a system somewhere. The entire exercise was copying data from where it lives to where the regulator wants to see it. And hoping nothing changed between the export and the signature.

The report assembly problem is really a platform problem.
The reason APRs take weeks isn't that the format is complex. It's that the data lives in five systems that don't share a data model. Batch data in the MES. Deviations in the QMS. Lab results in the LIMS. Stability in a separate module. Complaints in another. Each export has its own format, its own date conventions, its own way of counting. Reconciliation is the actual work. Making the numbers agree across systems that were never designed to agree.
When all of those systems are one platform, the reconciliation disappears. There's one batch record, one deviation count, one set of stability results. The APR doesn't assemble data from five sources. It queries one source with one data model. The numbers match because there's only one set of numbers.
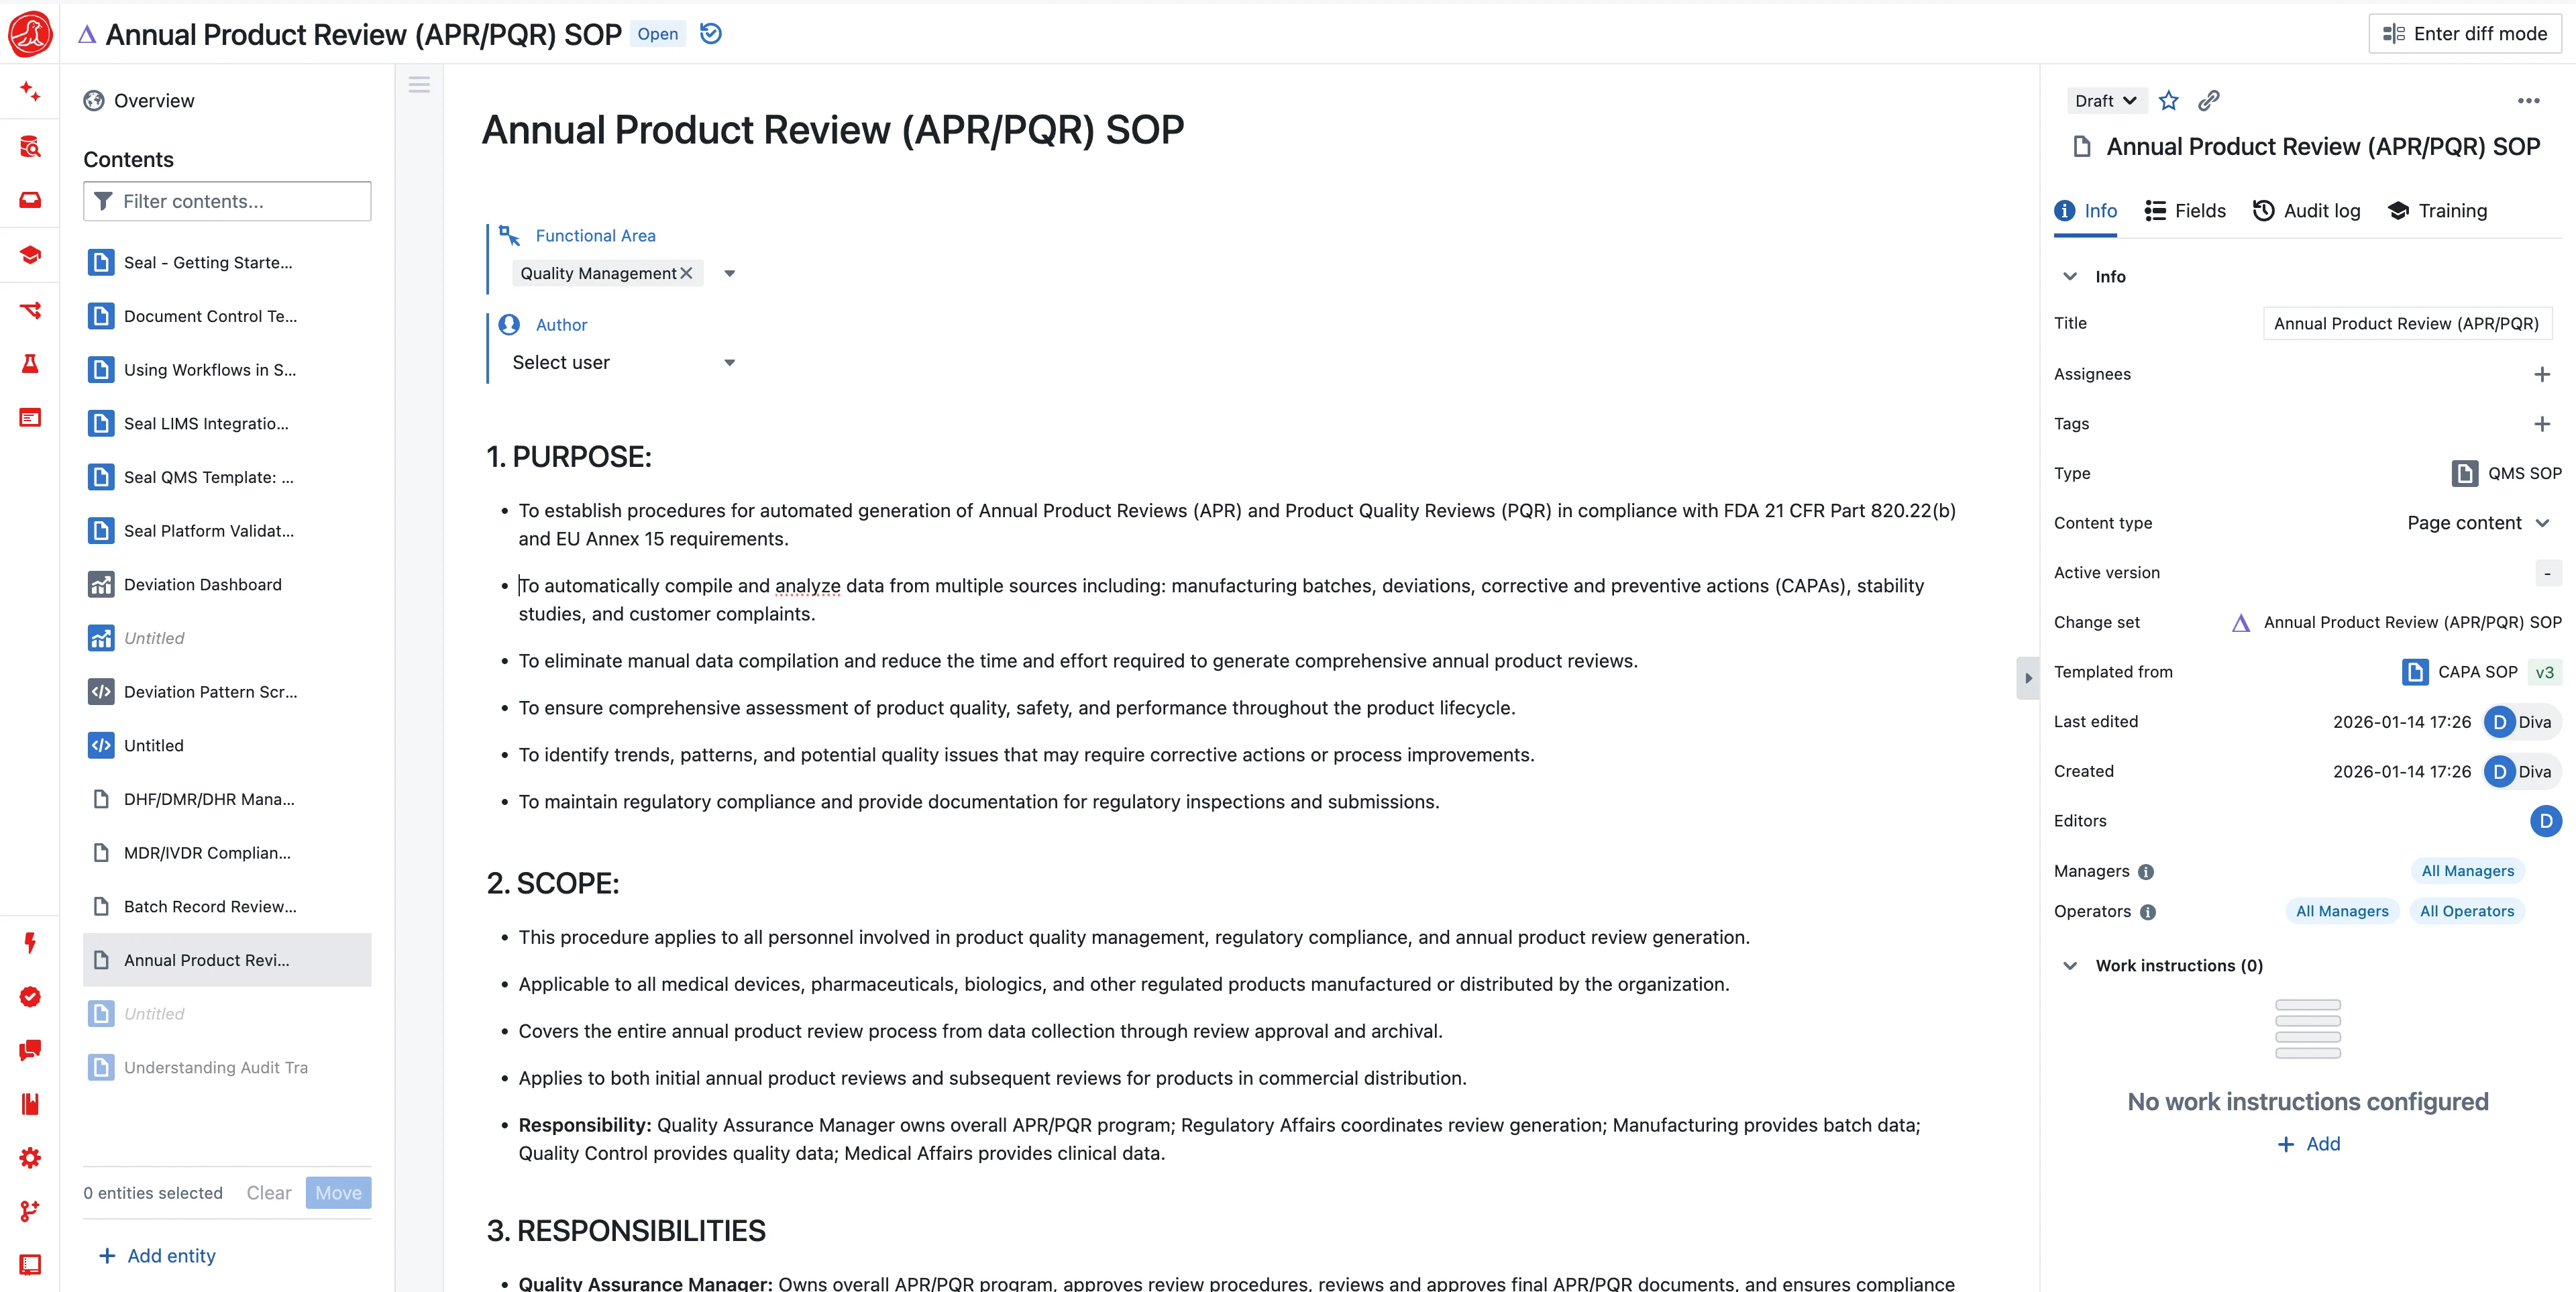
Seal generates the APR from a template: which data to pull, how to structure it, where AI should draft narrative. The batch summary table populates from batch records. Deviation trends compute from deviation data. AI reads the data and drafts the analysis: "Q3 showed a 23% increase in deviations compared to Q2, driven by equipment-related issues following the Line 2 bioreactor installation. All deviations were investigated and closed within 30-day targets." You review, edit, approve. Every number traces back to the source record.
The three people who spent four weeks now review a draft that took minutes to generate.
The report your management review actually needs.
Your monthly quality management review is supposed to drive decisions. Instead, it reviews data that's already three weeks old because someone had to compile it. The deviation trend that spiked in week two doesn't surface until the meeting in week five. By then, you've already had four more deviations from the same root cause.
Live dashboards change this. Deviation aging, CAPA effectiveness, training compliance, supplier rejection rates, batch right-first-time. All computed from the same platform where the work happens. Not a monthly snapshot, but a live view. When the VP of Quality wants to know where things stand, the answer is current, not historical.
When you do need a formal report. For a management review meeting, for an auditor, for a board update. The dashboard exports to a versioned PDF with audit trail. Same data, frozen at a point in time, with signatures.
Regulatory submissions from the same data.
The data in your APR overlaps heavily with your eCTD Module 3 submissions. Your process validation summary draws from the same batch records. Your CMC stability update uses the same stability data. In most organizations, each of these is assembled independently by different teams pulling from the same systems.
Seal uses the same underlying data with different templates for different destinations. FDA annual report format. eCTD Module 3 structure. EMA variation dossier. The data doesn't change. The template determines how it's presented. When a reviewer asks "where did this number come from?", the answer is a link to the source record, not a reference to an Excel export that may or may not still exist.
The audit question you can answer in seconds.
"Show me all deviations for Product X in 2024, with root cause categories and CAPA linkage." In a disconnected environment, this is a half-day exercise involving exports from two systems and manual cross-referencing. In Seal, it's a query that returns in seconds. Because deviations, root causes, and CAPAs are all in the same data model.
This changes how you prepare for audits. You don't pre-assemble binders of anticipated questions. You answer questions live, in front of the auditor, from the system. The confidence that comes from knowing any question can be answered immediately is worth more than any pre-assembled audit package.